A table depicts percent changes in employment between baseline and alternate scenarios (moderate and strong impact) from 2019-2029 for various occupational groups. Categories include healthcare, education, learning, IT, and more, with varying increases or decreases in percentages.
by careersingov | Jul 11, 2021
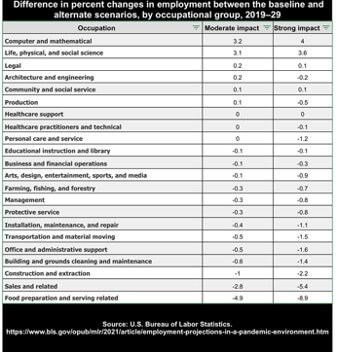
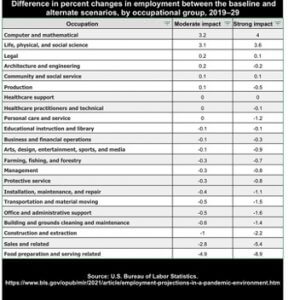
A table depicts percent changes in employment between baseline and alternate scenarios (moderate and strong impact) from 2019-2029 for various occupational groups. Categories include healthcare, education, learning, IT, and more, with varying increases or decreases in percentages.