A pie chart titled “How, if at all, did the size of your full-time workforce change over the past year?” reveals that 63% increased, 25% saw no change, 9% decreased, and 3% don’t know among public agencies. Total respondents: 295.
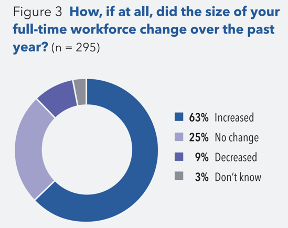
A pie chart titled “How, if at all, did the size of your full-time workforce change over the past year?” reveals that 63% increased, 25% saw no change, 9% decreased, and 3% don’t know among public agencies. Total respondents: 295.